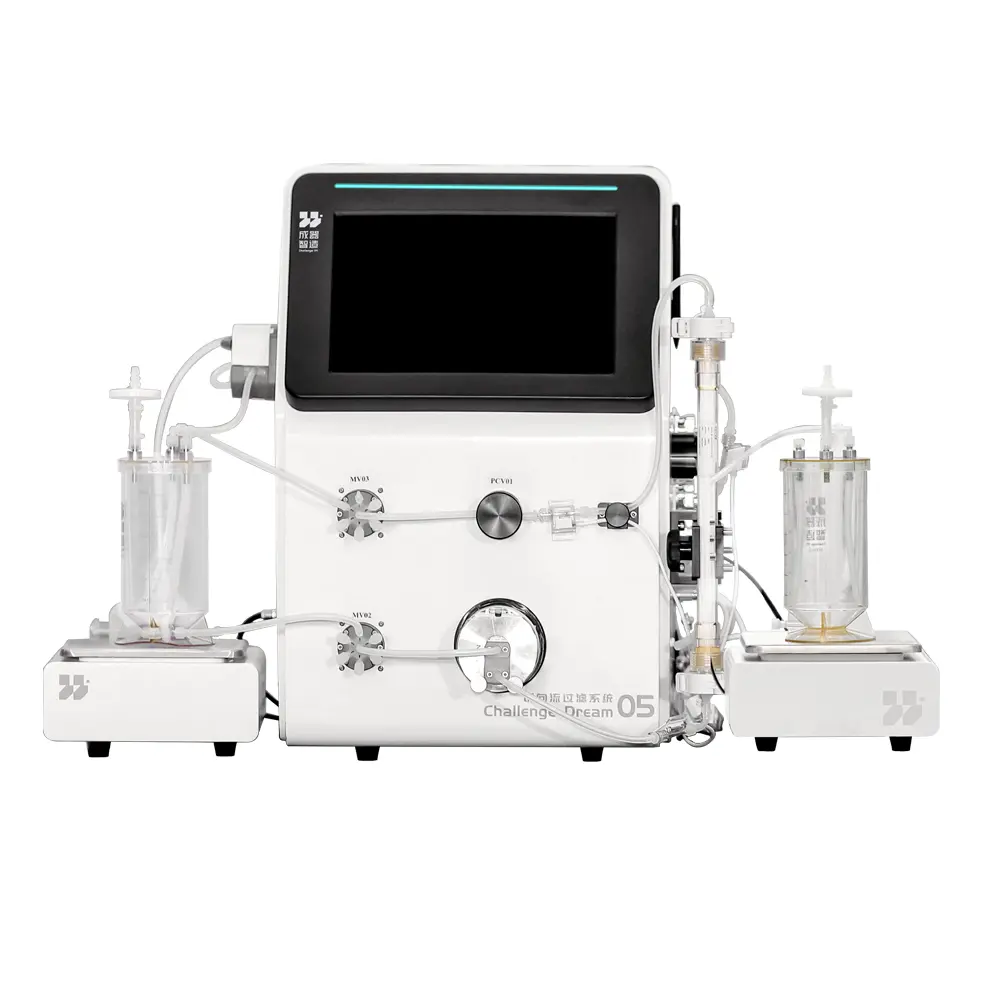
Choosing the right Nanofiltration Filter manufacturer requires more than comparing product prices or website claims. Membrane quality, manufacturing consistency, technical support, and verified field performance all influence long-term results. This guide examines leading manufacturers worldwide through practical and professional criteria.
The evaluation considers membrane materials, separation accuracy, pressure requirements, flow rates, and chemical compatibility. These details matter. A filter handling textile wastewater may need different performance from one treating drinking water. Buyers should also review laboratory data, pilot-test results, certifications, warranty terms, and replacement availability. Clear documentation can reveal whether a manufacturer understands real operating conditions or simply promotes impressive specifications.
Experience remains valuable. Manufacturers with installations in food processing, pharmaceuticals, municipal treatment, or industrial reuse often provide more useful engineering guidance. However, reputation alone is not enough. Performance varies. Independent testing, customer references, and transparent operating limits offer stronger evidence. Even respected suppliers may present data from ideal conditions that do not match a busy plant, fluctuating feedwater, or frequent cleaning cycles.
This introduction provides a balanced starting point for identifying the top Nanofiltration Filter manufacturers in the world. It focuses on measurable capability, responsible production, and dependable service rather than marketing language. Some comparisons may remain imperfect because product ranges, regional standards, and published data differ. That limitation deserves attention. Readers should confirm current specifications directly with manufacturers before approving a purchase, especially when water chemistry, energy consumption, and regulatory requirements are critical. A careful shortlist can reduce maintenance surprises and support safer, more efficient filtration decisions.
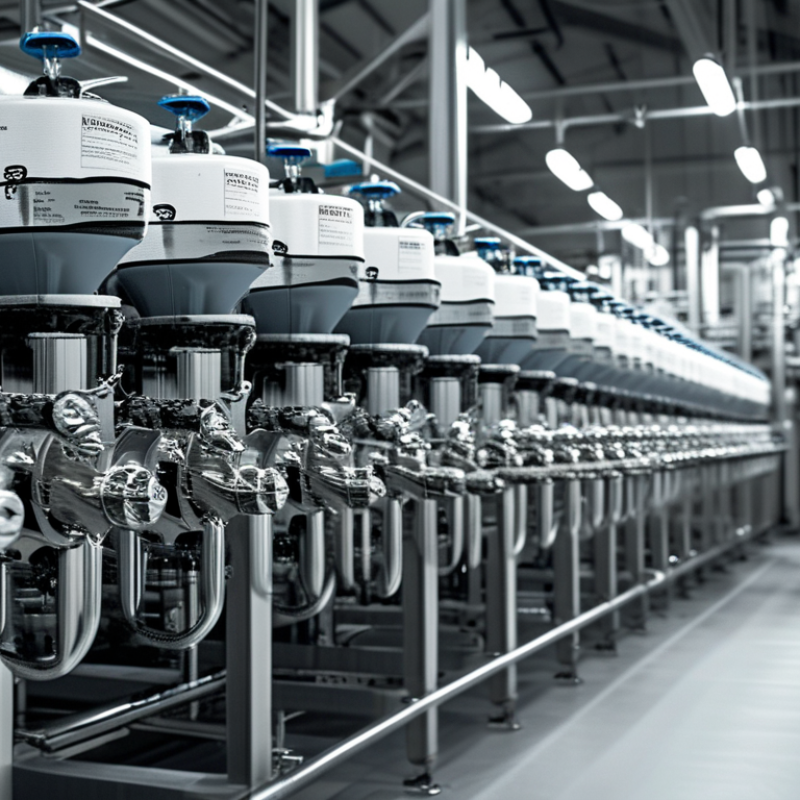
Nanofiltration is a pressure-driven membrane process used between ultrafiltration and reverse osmosis. Its selective pores, typically near the nanometer scale, allow water and small neutral molecules to pass. Larger organic compounds, suspended residues, and many divalent ions remain concentrated.
In modern water treatment, nanofiltration can soften hard water while using less energy than full desalination. It may reduce calcium, magnesium, color, pesticides, and selected trace contaminants. Operators often apply it to drinking water, industrial process water, and wastewater polishing. Performance depends on pressure, temperature, feed chemistry, and membrane condition. Small changes matter.
Reliable manufacturers usually support their filters with pilot testing, technical data, and documented quality controls. A serious evaluation should examine salt rejection, permeate flow, cleaning tolerance, service life, and replacement availability. Laboratory claims are useful, but field results are stronger evidence. Water professionals should test the actual source water before selecting equipment.
A common mistake is treating nanofiltration as a universal barrier. It is not. Some small neutral contaminants can pass through, while scaling may reduce output quickly. I have also seen designs focus heavily on initial flow and overlook cleaning frequency. That approach may look efficient on paper. It can become expensive in operation. Careful monitoring remains necessary.
Top Nanofiltration Filter Manufacturers in the World: Key Technologies Used in Manufacturing
Nanofiltration manufacturing begins with thin-film composite membranes. Interfacial polymerization forms a selective polyamide layer, often thinner than one micrometer. This layer rejects multivalent salts, pesticides, and organic molecules. Support strength still matters. A weak substrate can deform under pressure and reduce separation consistency. Manufacturers therefore control monomer concentration, coating speed, curing temperature, and surface roughness during production.
MarketsandMarkets estimates the global nanofiltration membrane market could grow from about USD 1.0 billion in 2023 to USD 1.5 billion by 2028. Its analysis indicates an annual growth rate near 8.8%. Ceramic membranes receive attention because they tolerate heat, solvents, and aggressive cleaning. Polymeric membranes remain attractive because they cost less and offer flexible module designs. The trade-off is uncomfortable. Higher chemical resistance may increase manufacturing expense.
Modern production also uses hollow-fiber spinning, automated defect inspection, and crossflow testing. Scanning electron microscopy checks the active layer, while zeta-potential testing helps predict fouling behavior. A 2024 Grand View Research analysis identifies water reuse and industrial wastewater treatment as major demand areas. Yet laboratory flux results can mislead. Real feedwater contains oil, colloids, and changing salt levels. Reliable manufacturers test membranes with realistic water, not only clean solutions. Even then, performance claims need cautious interpretation, because temperature and pretreatment strongly affect reported flow rates.
| Technology Dimension | Common Technical Data | Key Manufacturing Technology | Typical Performance | Typical Applications |
|---|---|---|---|---|
| Membrane Material | Thin-film composite polyamide is the most widely used active layer. | Interfacial polymerization forms an ultrathin polyamide selective layer on a porous support. | High rejection of divalent ions and many dissolved organic compounds while allowing a substantial portion of monovalent salts to pass. | Water softening, color removal, wastewater reuse, and food-process concentration. |
| Effective Separation Range | Approximate nominal molecular-weight cut-off: 150–1,000 Da, depending on membrane structure and test conditions. | Controlled cross-linking, monomer concentration, reaction time, and curing conditions adjust the selective-layer density. | Separates many pesticides, dyes, natural organic matter, and hardness-forming ions. | Micropollutant reduction, demineralization polishing, and industrial process-water treatment. |
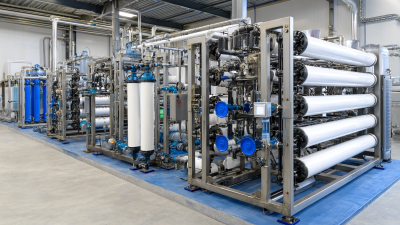
| Membrane Configuration | Spiral-wound elements are standard; hollow-fiber and flat-sheet formats are also used for specialized systems. | Automated membrane rolling, permeate-spacer placement, adhesive sealing, element cutting, and pressure-vessel assembly. | Compact equipment footprint and high membrane area per element. | Municipal systems, commercial water treatment, and industrial skid-mounted units. |
| Operating Pressure | Typically about 5–25 bar, with the required pressure varying according to feed salinity, temperature, recovery, and membrane type. | Pressure-rated housings, feed spacers, end caps, seals, and permeate tubes are designed to withstand continuous hydraulic loading. | Lower pressure demand than conventional reverse osmosis in many softening and organic-removal applications. | Low-energy water softening, boiler-feed pretreatment, and partial desalination. |
| Salt Rejection Selectivity | Divalent-ion rejection is commonly high, while monovalent-ion rejection is generally lower and membrane-specific. | Charge density, free-volume control, surface chemistry, and selective-layer thickness are optimized during coating and curing. | Useful balance between hardness removal and retention of some beneficial monovalent minerals. | Drinking-water softening, mineral adjustment, and agricultural-water treatment. |
| Surface Modification | Hydrophilic coatings, zwitterionic layers, and other low-fouling surface treatments may be applied. | Grafting, plasma treatment, coating, or incorporation of hydrophilic functional groups reduces surface adhesion. | Improved wettability, lower organic fouling tendency, and more stable long-term flux. | Surface-water treatment, wastewater reuse, and feeds containing natural organic matter. |
| Anti-Fouling Design | Low-roughness surfaces, hydrophilic chemistry, and optimized feed spacers are commonly used. | Precision control of surface morphology, spacer geometry, and cross-flow hydrodynamics limits concentration polarization. | Reduced deposition of colloids, proteins, oils, and organic matter under suitable pretreatment conditions. | Food and beverage processing, textile wastewater, and industrial reuse systems. |
| Permeability and Flux | Typical water flux may range from approximately 10–40 L/m²·h, depending on pressure, temperature, feed composition, and membrane grade. | Selective-layer thickness, support porosity, solvent exchange, and roll-to-roll coating uniformity are tightly controlled. | Higher permeability than many reverse-osmosis membranes at comparable test conditions. | High-throughput polishing, process-water recovery, and concentration of aqueous streams. |
| Chemical Compatibility | Polyamide membranes are sensitive to strong oxidants such as free chlorine and require compatible cleaning chemicals. | Material selection, protective pretreatment, and chemical-resistance testing are integrated into product development. | Longer service life when oxidant exposure, pH, temperature, and cleaning conditions remain within specification. | Municipal and industrial systems with online pretreatment and controlled cleaning cycles. |
| Quality Control | Common checks include salt rejection, water permeability, defect detection, dimensions, seal integrity, and pressure testing. | Automated testing, sample-based performance verification, clean-room handling, and batch traceability support consistent production. | More uniform element performance and lower risk of premature leakage or abnormal flux decline. | Critical water-treatment installations requiring predictable operating results. |
| Digital and System Integration | Modern systems may include conductivity, pressure, flow, temperature, and differential-pressure monitoring. | Sensor integration, programmable control logic, automatic flushing, energy-efficient pumps, and data-based membrane-cleaning schedules. | Improved process stability, easier maintenance planning, and better tracking of normalized permeate performance. | Smart municipal plants, industrial water reuse, and remotely monitored treatment skids. |
Note: Performance values are representative industry ranges. Actual results depend on membrane grade, feed-water chemistry, temperature, pressure, recovery, pretreatment, and test methods.
Leading nanofiltration manufacturers differ by region, process expertise, and target market. European producers often focus on municipal water reuse, pharmaceutical purification, and strict energy standards. Their systems usually include detailed membrane testing, automated cleaning cycles, and documented material traceability. These features support projects where validation and stable performance matter.
Manufacturers in North America commonly serve industrial water treatment, food processing, and power generation. Their designs often emphasize modular skids, remote monitoring, and quick membrane replacement. Asian manufacturers have expanded strongly in electronics, textile, and desalination markets. Many offer compact systems for high-throughput facilities, with close attention to footprint and operating cost. Regional suppliers may also provide faster technical support and more flexible customization.
Market focus changes the right selection. A food plant may need low-pressure operation and hygienic construction. A chemical facility may prioritize solvent resistance, pressure tolerance, and predictable rejection. Typical nanofiltration systems operate between 5 and 25 bar, but actual requirements depend on feed chemistry and temperature. A low price can hide higher cleaning frequency. It happens.
Buyers should examine pilot data, membrane lifespan, salt rejection, and local service capacity. Ask for performance results using feedwater similar to the real site. Laboratory figures can look excellent, yet field conditions often include fouling, scaling, and seasonal variation. No regional ranking is completely objective. Performance depends on engineering discipline, application knowledge, and after-sales reliability.
Comparing nanofiltration filters for industrial applications requires more than checking pore size. Global manufacturers often quote nominal molecular weight cutoff, but testing methods can differ. Ask for data from a feed similar to yours, not only clean-water results. A pilot skid can reveal flux decline, salt rejection, and pressure needs within days. Record temperature, pH, turbidity, and recovery during each run.
Material selection matters. Polyamide membranes often provide strong separation, while ceramic options may tolerate harsher cleaning and higher temperatures. The better choice depends on wastewater chemistry, not marketing language. Examine membrane area, element dimensions, vessel compatibility, and replacement access. In a 2 m³/h process line, small pressure losses can noticeably increase pump energy. Check the full operating envelope, including start-up and low-flow conditions.
Reliable suppliers provide traceable test reports, cleaning procedures, failure guidance, and realistic delivery times. Request references from comparable industries, while verifying claims independently. Ask how performance is measured after three, six, and twelve months. A polished datasheet is useful, but it is not proof. I would also compare warranty limits, commissioning support, sensor requirements, and spare-part availability. Some evaluations overlook cleaning water and downtime; that was a costly omission in one assessment. Lifecycle cost should sit beside the initial price.
Nanofiltration manufacturers are adapting to stricter water-quality targets and rising energy costs. Modern systems must remove hardness, color, pesticides, and selected dissolved organics with lower pressure. This demand is pushing manufacturers toward thinner membrane layers and improved surface chemistry. Some facilities now use digital monitoring to track pressure, conductivity, and salt rejection in real time. These tools reveal fouling earlier, although sensor data is not always perfect.
Material innovation is another major trend shaping nanofiltration manufacturing. Engineers are testing ceramic supports, advanced polymers, and hybrid membrane structures. These designs may improve chemical resistance and service life. However, laboratory performance can differ from results in a busy treatment plant. I have seen promising membranes lose efficiency when feedwater changes rapidly. Manufacturers should therefore publish long-term test results, cleaning requirements, and performance under realistic operating conditions. Clear technical evidence builds trust more effectively than impressive recovery claims.
Tips: Compare lifecycle costs, not only purchase prices. Ask for pilot-test data using similar feedwater. Check cleaning intervals, operating pressure, and replacement procedures. Leave room for uncertainty; water chemistry rarely stays stable. A reliable supplier explains limitations clearly.
Industry Trends Shaping the Future of Nanofiltration Manufacturing
The chart presents an indexed global nanofiltration membrane market projection, with 2024 set as the baseline of 100. The trajectory applies a publicly reported compound annual growth rate of approximately 7.2% through 2030. Growth is supported by increasing water reuse, industrial wastewater treatment, energy-efficient separation, and demand for selective removal of divalent ions and micropollutants. The index is not company revenue data.
Reference basis: publicly available industry market forecasts reporting approximately 7.2% CAGR for nanofiltration membranes during 2024–2030; values are mathematically indexed from the reported growth rate.