How to Choose the Right Ultrafiltration System?
Choosing the right Ultrafiltration system begins with understanding your water, not selecting the largest membrane package. Feed composition, flow variation, temperature, and required product quality all influence performance. A system treating clear groundwater may need very different protection than one treating surface water with algae, silt, or organic matter.
In practical projects, operators usually examine membrane pore size, transmembrane pressure, flux rate, recovery, and cleaning requirements. These figures should match the real operating conditions. A high flux rate may appear efficient, but it can increase fouling and cleaning frequency. Small details matter. Pretreatment can determine success. Screens, cartridge filters, coagulation, or pH adjustment may protect the membranes and stabilize production.
Reliable selection also requires reviewing the manufacturer’s testing data, materials, service record, and available technical support. Independent certifications and documented pilot results can provide stronger evidence than attractive brochures. Ask how the system performs during peak demand, cold water periods, and unexpected turbidity spikes. These questions reveal practical weaknesses.
No checklist is perfect. Site conditions often change after installation. A pilot test remains one of the safest ways to confirm flux, cleaning intervals, and water quality before committing to a full-scale design. Operators should also calculate energy use, replacement membrane costs, wastewater handling, and maintenance labor. The cheapest purchase price may not deliver the lowest lifetime cost.
This guide explains the key decisions clearly, while recognizing that every application has limits, trade-offs, and occasional surprises. Good engineering leaves room for revision.
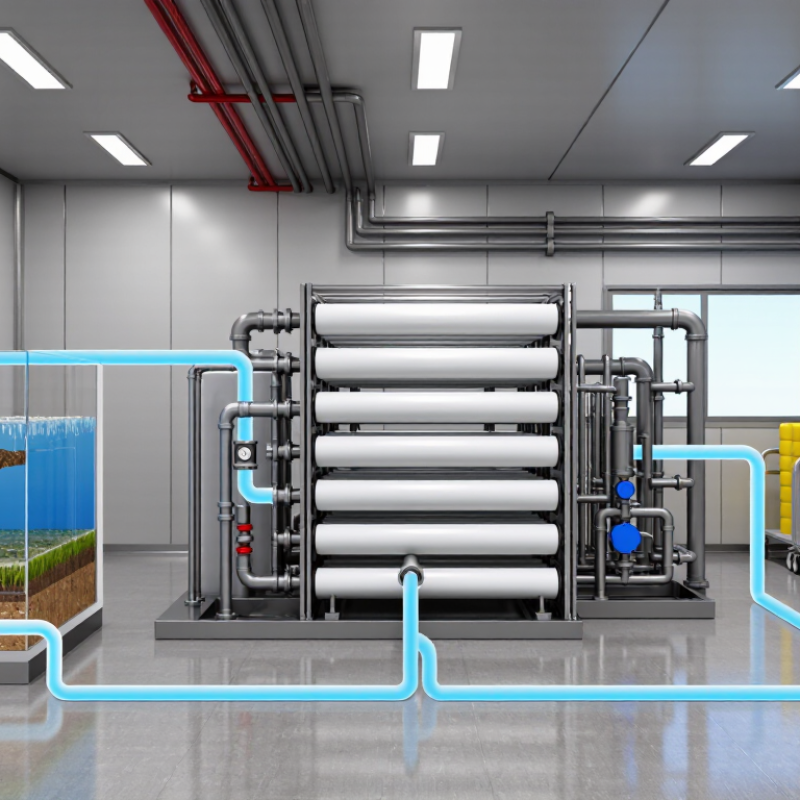
Define Feedwater Quality and Goals: Turbidity, TSS, and Pathogen Levels
Choosing the right ultrafiltration system starts with measuring feedwater, not comparing equipment brochures.
Turbidity shows how cloudy water appears, but it does not reveal every contaminant. TSS measures suspended particles by weight and helps estimate solids loading. Pathogen data identifies microbial risks that membrane separation must address. Collect samples during dry weather, heavy rain, and peak production.
One sample can mislead.
Experienced operators record turbidity in NTU and TSS in milligrams per liter. They also test indicators such as E. coli and total coliforms when microbial safety matters.
These results should connect directly to the treatment goal. Drinking water, process water, and reuse applications require different performance targets. A system designed for low turbidity may struggle when solids suddenly rise. Pretreatment may be necessary.
Do not trust averages alone.
A short pilot test can reveal rapid fouling, pressure increases, and difficult cleaning cycles. I have seen designs look suitable on paper but perform poorly during seasonal changes. That mistake is easy to repeat. Monitor feedwater temperature too, because colder water often reduces membrane flow.
After installation, keep daily records of turbidity, TSS, pressure, flow, and cleaning frequency. A clear filtrate is encouraging, but it is not automatic proof of pathogen control. Independent validation and routine testing remain essential.
Match Membrane Ratings: 0.01–0.1 µm Pores and 1–300 kDa MWCO
How to Choose the Right Ultrafiltration System?
Ultrafiltration selection begins with the membrane rating, not the equipment frame. Pore sizes from 0.01 to 0.1 µm indicate physical openings. Smaller pores usually provide stronger retention of colloids, proteins, and suspended particles. However, pore size and molecular weight cutoff are not interchangeable measurements. That distinction matters. A 1 kDa MWCO membrane is much tighter than a 300 kDa membrane. It can retain smaller dissolved molecules, while a 300 kDa rating allows more passage and often supports higher flow.
In practical testing, operators should compare the target contaminant with both ratings. A process handling large proteins may need a 10–100 kDa MWCO. Smaller peptides may require a lower cutoff. For clarification, a 0.05–0.1 µm membrane could be suitable, depending on particle shape and feed conditions. Real retention can differ from the catalog value. Test before scaling. Manufacturers commonly define MWCO near a stated retention percentage, but test chemistry, temperature, and concentration can change performance.
Membrane choice also affects flux and cleaning frequency. A tighter membrane may deliver better separation but foul faster. Watch the pressure rise across the module. Record permeate flow, conductivity, turbidity, and target-solute recovery during trials. One overlooked detail is viscosity; a cold, concentrated feed can reduce flow sharply. I would avoid choosing by pore size alone. It looks simple, but real process data usually exposes the weak assumption.
How to Choose the Right Ultrafiltration System? - Match Membrane Ratings: 0.01–0.1 µm Pores and 1–300 kDa MWCO
| Typical Pore Size |
Typical MWCO |
Primary Separation Range |
Typical Targets Retained |
Common Applications |
Selection Considerations |
| 0.01 µm |
Approximately 1–10 kDa |
Tight ultrafiltration |
Proteins, enzymes, colloids, endotoxin-associated aggregates, and many bacteria |
Protein concentration, enzyme processing, high-quality process-water polishing |
Provides stronger macromolecule retention but usually has lower flux and higher fouling sensitivity. |
| 0.02 µm |
Approximately 5–30 kDa |
Fine ultrafiltration |
Most proteins, colloids, suspended solids, and bacteria under suitable operating conditions |
Bioprocess clarification, protein recovery, and microbial reduction |
A practical choice when high retention is needed without selecting the tightest available membrane. |
| 0.05 µm |
Approximately 30–100 kDa |
Standard ultrafiltration |
Colloids, suspended solids, many proteins, and bacteria larger than the effective separation threshold |
Surface-water polishing, wastewater reuse pretreatment, and macromolecule concentration |
Often balances flux, retention, and cleaning requirements; verify performance with the actual feed. |
| 0.10 µm |
Approximately 100–300 kDa |
Open ultrafiltration |
Suspended solids, colloids, cell debris, and larger microorganisms |
Cell harvesting, clarification, wastewater solids removal, and pretreatment for tighter membranes |
Typically offers higher permeability, but smaller proteins and dissolved contaminants may pass through. |
Important: Pore size and MWCO are nominal ratings, not direct equivalents. Actual retention depends on membrane material, solute shape, concentration, polarization, feed chemistry, pressure, temperature, and operating mode. Confirm the selected rating with pilot testing or validated retention data. Ultrafiltration is not automatically a virus-removal barrier, and microbial claims should be verified for the specific system.
Size Capacity and Flux: 50–150 L/m²·h at 0.5–2.5 bar TMP
How to Choose the Right Ultrafiltration System?
Size, Capacity, and Flux: 50–150 L/m²·h at 0.5–2.5 bar TMP
Choosing an ultrafiltration system starts with the required flow, not the equipment frame. Define the daily volume, peak flow, and operating hours. A system treating 10,000 liters daily at 100 L/m²·h needs about 10 m² of membrane area during ten hours. Add practical capacity for cleaning, downtime, and seasonal demand. The first estimate is rarely perfect.
Flux commonly falls between 50 and 150 L/m²·h. The correct value depends on feed quality, temperature, solids, viscosity, and membrane condition. Cleaner water may support higher flux. Concentrated or oily feeds often require lower flux. Running too aggressively can increase fouling and shorten cleaning intervals. That hidden cost matters.
Transmembrane pressure, or TMP, usually operates between 0.5 and 2.5 bar for many ultrafiltration applications. Higher pressure does not always produce higher output. Beyond a practical point, it may compact the fouling layer instead. Operators should monitor permeate flow, pressure, turbidity, and cleaning frequency together. Small changes can reveal trouble early.
Pilot testing provides stronger evidence than a catalogue rating. Test the actual feed for several hours, including a cleaning cycle. Record flux decline and recovery. A conservative design is often easier to operate. Still, every site has surprises. Temperature changes alone can distort a neat calculation.
Select Membrane Materials and Modules: PVDF, PES, Hollow-Fiber, or Tubular
Choosing an ultrafiltration system starts with the membrane material and module design. These choices affect separation, cleaning, energy use, and service life.
PVDF offers strong mechanical durability and good resistance to many cleaning conditions. It often suits wastewater with variable feed quality. PES can provide high permeability and stable performance in demanding water-treatment processes. However, chemical compatibility depends on concentration, temperature, and exposure time. Never select a polymer from a data sheet alone. Real feed conditions matter.
Hollow-fiber modules provide a large membrane area in a compact frame. They work well when the feed contains limited suspended solids and receives reliable pretreatment. Narrow passages can foul quickly when fibers meet hair, oil, or poorly screened particles. Tubular modules use wider flow channels and tolerate heavier solids more effectively. They require more floor space and may consume more pumping energy. That trade-off is easy to underestimate.
During selection, measure turbidity, temperature, viscosity, and cleaning frequency. Record flux decline during a controlled pilot test. A short test can reveal more than a promising specification sheet. Consider backwashing access, module replacement, and operator skill. Laboratory water may produce unrealistic results. Full-scale water rarely behaves so politely. A careful design leaves room for uncertainty.


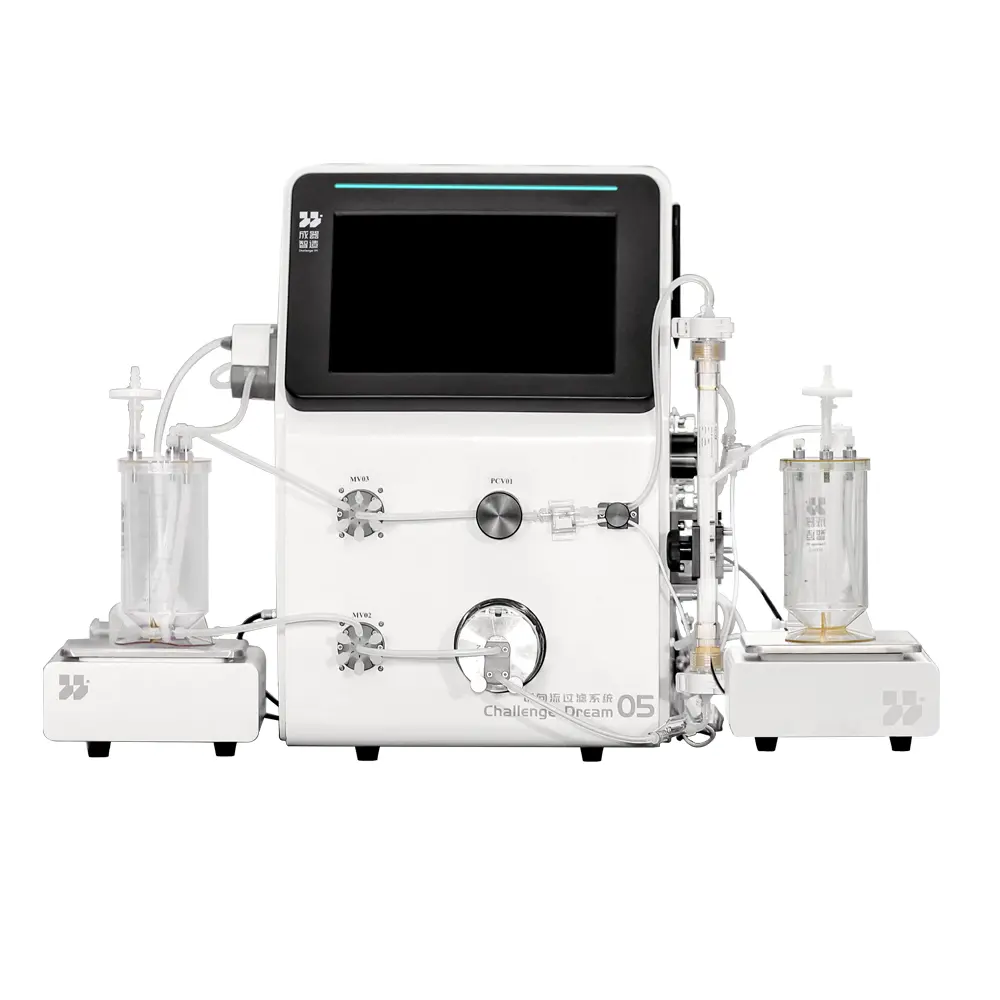 Tangential Flow Filtration(TFF) System
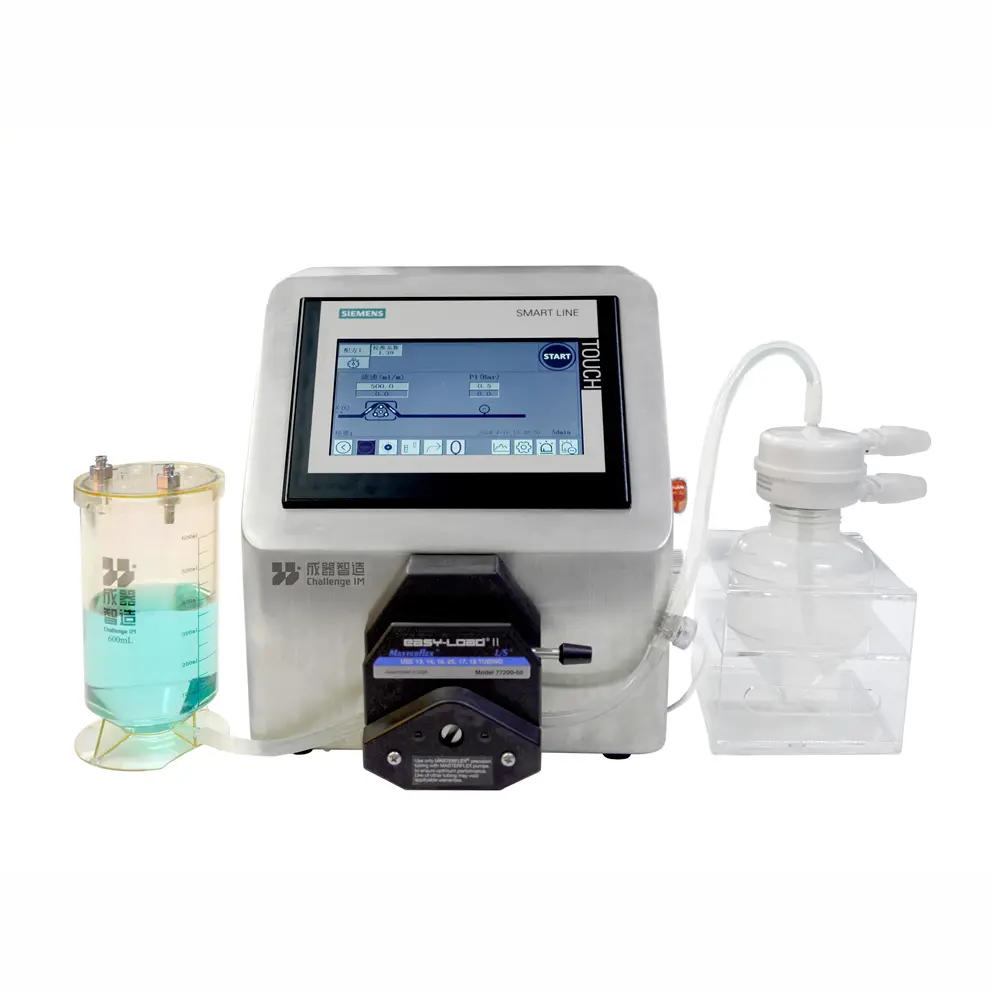 Jump Pump
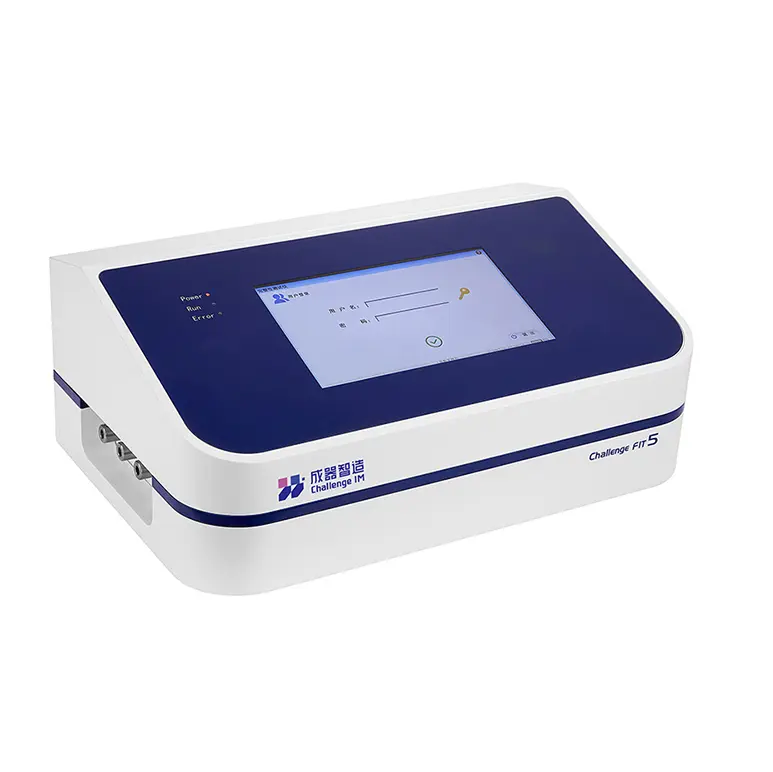 FIT Integrity Tester
 High Pressure Homogenizers
 Microfluidics