zh-cn
  • sns01-1
  • sns04-1
  • sns02-1
Leave Your Message

10 Best Nanofiltration Systems for Global Buyers

Choosing the right Nanofiltration System requires more than comparing catalog prices. Global buyers must examine feed-water chemistry, membrane material, recovery rate, energy demand, and after-sales support. A compact skid may fit a factory floor, yet poor pretreatment can quickly damage its membranes.

The market need is real. The WHO and UNICEF Joint Monitoring Programme reported that 2.2 billion people lacked safely managed drinking water in 2022. UNESCO’s 2024 World Water Development Report also expects global water demand to rise by 20–30% by 2050. These figures explain why nanofiltration is gaining attention for drinking water, industrial reuse, food processing, and selective softening. MarketsandMarkets estimates continued growth across the broader membrane filtration sector, although market figures differ between research firms. That variation deserves caution.

Professor Menachem Elimelech, a leading membrane researcher, has written, “Membrane technology is a key component of sustainable water purification.” His work highlights an important buying lesson: separation performance must be balanced with fouling control and operating cost. The best system is not always the one with the highest rejection rate. Sometimes, it is the unit that remains stable after months of variable feed conditions.

This guide compares ten systems for international buyers. It considers practical details, including stainless-steel housings, automated cleaning cycles, cartridge availability, and documented test conditions. Some product claims remain difficult to verify. Buyers should request pilot data, independent analysis, and lifecycle cost estimates before committing.
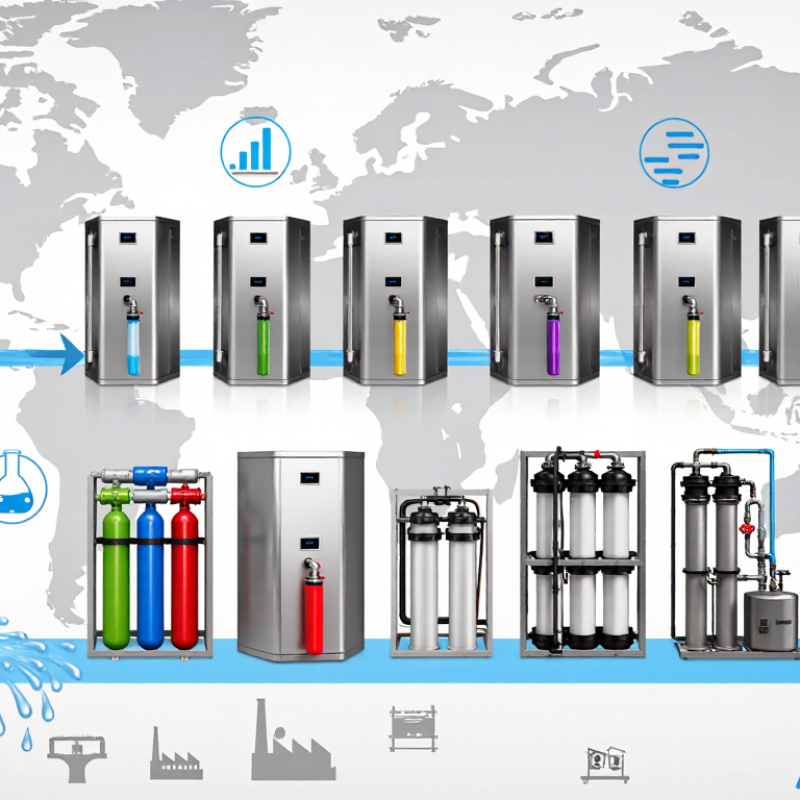
10 Best Nanofiltration Systems for Global Buyers

What Nanofiltration Systems Are and How They Work

Nanofiltration systems are pressure-driven water treatment units. They use a semi-permeable membrane to separate dissolved substances from water. The membrane has smaller openings than ultrafiltration membranes. However, it is less restrictive than reverse osmosis. This difference affects pressure, energy use, and mineral removal.

In practical operation, feed water passes across the membrane surface. Pressure pushes part of the water through the selective layer. This stream is called permeate. The remaining flow carries concentrated salts and contaminants away. Nanofiltration commonly reduces hardness, color, larger organic molecules, and many divalent ions. It does not remove every dissolved substance. That limitation matters.

Typical systems require pretreatment. Sediment filters can protect the membrane from particles. Carbon treatment may reduce chlorine and organic loading. Operators must also control scaling, fouling, and sudden pressure changes. Field readings often include feed pressure, permeate flow, conductivity, and recovery rate. Small details matter.

Nanofiltration can operate at lower pressure than reverse osmosis, but exact requirements depend on water chemistry. A system designed for surface water may perform poorly on a mineral-rich well source. The membrane is not magic. Poor cleaning schedules can shorten its service life. Some designs still disappoint because they ignore seasonal changes in feed water. Reliable selection requires laboratory testing, realistic flow targets, and clear maintenance procedures.
10 Best Nanofiltration Systems for Global Buyers

What Nanofiltration Systems Are and How They Work

Nanofiltration systems use pressure-driven membranes with separation performance between ultrafiltration and reverse osmosis. They commonly remove hardness ions, color compounds, dissolved organic matter, and selected contaminants while allowing much of the water and some monovalent salts to pass through. The chart shows typical operating-pressure windows reported for common nanofiltration applications; actual values depend on membrane chemistry, water temperature, recovery, pretreatment, and feedwater quality.

Typical engineering ranges: approximately 5–25 bar. Values are application-level ranges and do not represent any specific company or brand.

Key Performance Criteria for Comparing Nanofiltration Systems

10 Best Nanofiltration Systems for Global Buyers

Key Performance Criteria for Comparing Nanofiltration Systems

Global buyers should compare nanofiltration systems by measured performance, not brochure claims. The key evidence is a recent pilot report using water similar to the intended feed. Record permeate flow, salt rejection, operating pressure, temperature, and recovery rate. Small temperature changes can distort comparisons. Test the actual water.

Membrane selectivity matters, but it is only one part of system performance. A strong system should remove hardness, color, and selected dissolved contaminants while preserving useful minerals when required. Check flux decline after several operating days. Rapid decline may indicate fouling, poor pretreatment, or unsuitable membrane selection.

No system is perfect.

Energy use deserves close attention. Compare kilowatt-hours per cubic meter, not only pump pressure. Review cleaning frequency, chemical demand, membrane replacement intervals, and wastewater volume. These details shape the real operating cost. A low purchase price can become expensive after repeated maintenance.

Buyers should also inspect control features, instrumentation, and service documentation. Pressure gauges, conductivity sensors, and automatic shutdowns support safer operation and clearer troubleshooting. Ask whether local technicians can access spare parts and training. Certification requirements vary by country, so verify them before procurement. A spreadsheet can mislead when it ignores seasonal feedwater changes, installation quality, or operator skill. Pilot results are useful, but they still need careful interpretation.

Ten Leading Nanofiltration Systems for Global Buyers

Ten Leading Nanofiltration Systems for Global Buyers

The ten leading nanofiltration systems serve different water problems, not one universal market. Practical options include municipal drinking-water units, brackish-water systems, food-processing skids, pharmaceutical pretreatment, textile wastewater units, mining-water systems, boiler-feed polishing, agricultural reuse, residential modules, and containerized emergency plants. Each design needs evidence. Typical nanofiltration membranes operate between 5 and 25 bar, while molecular weight cut-offs commonly range from 200 to 1,000 daltons. These figures help buyers compare pressure demand, salt rejection, and energy use.

Water scarcity makes this comparison urgent. UNESCO’s United Nations World Water Development Report 2024 states that agriculture represents about 70% of global freshwater withdrawals. The WHO/UNICEF Joint Monitoring Programme reported in 2023 that 2.2 billion people lacked safely managed drinking water. Therefore, global buyers should examine recovery rate, pretreatment quality, cleaning frequency, and local service capacity. A compact system may suit a remote clinic, but not a high-fouling textile plant. Small details matter.

Do not trust glossy specifications alone. Independent testing should measure turbidity, hardness, conductivity, and microbial indicators before and after treatment. The International Desalination Association also emphasizes lifecycle performance, not only membrane rejection. That principle is easy to overlook. Some systems consume less energy but require frequent chemical cleaning. Others achieve higher recovery yet suffer faster scaling. The best selection remains imperfect without site trials, operator training, spare-parts access, and transparent five-year operating costs.

Applications, Feedwater Compatibility, and Operating Requirements

10 Best Nanofiltration Systems for Global Buyers

The ten best nanofiltration systems should be judged by application, not brochure claims. A ranking can still mislead. Feedwater chemistry changes daily, especially in industrial reuse. Municipal surface water usually needs coagulation, cartridge filtration, and turbidity control before NF. Groundwater may need iron, manganese, or hardness treatment. Oily feeds remain difficult without effective separation and pretreatment.

AWWA’s M46 manual identifies nanofiltration as a lower-pressure process than conventional reverse osmosis. Typical operation often falls near 5–25 bar, depending on salinity, temperature, and membrane selection. NF commonly removes divalent ions, color, and many natural organic compounds. It does not guarantee complete removal of monovalent salts or every trace contaminant. System buyers should request verified rejection data using their own feedwater.

The 2024 United Nations World Water Development Report states that 2.2 billion people lacked safely managed drinking water in 2022. This pressure increases interest in compact treatment for reuse and decentralized supply. However, efficiency cannot replace maintenance. Operators should check recovery, concentrate disposal, cleaning frequency, and energy consumption. A practical design may target 70–85% recovery, but scaling risk can reduce that figure. pH limits, temperature, and cleaning chemicals must match the membrane material. Pretreatment performance matters more than many buyers expect. I would still require a pilot test before final selection, because laboratory results rarely capture seasonal fouling.

10 Best Nanofiltration Systems for Global Buyers - Applications, Feedwater Compatibility, and Operating Requirements
No. Nanofiltration System Type Typical Molecular Weight Cut-Off Primary Applications Compatible Feedwater Typical Operating Pressure Typical Recovery Operating Temperature Key Pretreatment Requirements Main Operating Considerations
1 Low-Pressure Water-Softening NF System Approximately 150–300 Da Hardness reduction Drinking-water polishing Boiler make-up Low-to-moderate salinity groundwater or surface water with soluble calcium and magnesium 5–12 bar 70–90% 5–35°C Coarse screening, multimedia or cartridge filtration, turbidity control, and dechlorination for chlorine-sensitive membranes Suitable for divalent-ion removal while allowing a substantial portion of monovalent salts to pass. Scaling control is required when hardness and alkalinity are high.
2 Surface-Water Organic-Matter NF System Approximately 150–250 Da Color removal Natural organic matter Disinfection by-product control Reservoir water, river water, and lake water after clarification or ultrafiltration 6–15 bar 75–90% 5–30°C Coagulation or clarification, fine filtration, biological-control measures, and low-turbidity feed Organic fouling can reduce flux. Regular cleaning and stable upstream clarification are important during seasonal changes in water quality.
3 Brackish-Water NF Desalination System Approximately 150–300 Da Partial desalination Industrial process water Potable-water pre-treatment Brackish groundwater and mildly saline water, generally below approximately 5,000 mg/L TDS 8–20 bar 60–85% 10–35°C 5–10 µm cartridge filtration, antiscalant or softening where necessary, dechlorination, and iron/manganese removal NF is not a full replacement for reverse osmosis when very low conductivity is required. Recovery depends strongly on sulfate, silica, hardness, and concentrate limits.
4 Sulfate-Selective NF System Approximately 150–250 Da Sulfate removal Mining water Oilfield injection-water preparation Brackish groundwater or industrial water containing elevated sulfate and hardness 10–25 bar 50–80% 10–35°C Removal of suspended solids, oil, iron, and manganese; cartridge filtration; scaling control; dechlorination when required High sulfate rejection may increase concentrate scaling risk. Calcium sulfate and barium/strontium sulfate saturation should be checked during design.
5 Food and Beverage Process-Water NF System Approximately 150–300 Da Sugar concentration Dairy processing Juice and beverage clarification Clarified process streams with controlled organic loading and suitable sanitary conditions 5–20 bar 50–85% 5–50°C, subject to membrane and sanitation limits Sanitary prefiltration, hygienic piping, removal of coarse solids, and validated cleaning and sanitation procedures Food-contact materials, cleaning chemicals, temperature, and residence time must comply with the applicable local food-safety requirements.
6 Textile and Dyeing Wastewater NF System Approximately 150–400 Da Color removal Dye recovery Water reuse Biologically treated textile effluent with reduced suspended solids and oil content 8–25 bar 50–80% 10–40°C Equalization, biological treatment, clarification, ultrafiltration or fine filtration, and dechlorination Surfactants, polymers, and residual dyes can cause severe fouling. A pilot test is recommended before selecting flux and cleaning frequency.
7 Landfill-Leachate Polishing NF System Approximately 150–300 Da Leachate polishing Color reduction Organic contaminant reduction Biologically treated and clarified mature landfill leachate 10–30 bar 40–70% 10–35°C Ammonia treatment where necessary, biological treatment, coagulation or clarification, ultrafiltration, and cartridge filtration Concentrate disposal is a major design issue. Ammonia, refractory organics, scaling, and variable feed composition require continuous monitoring.
8 Pharmaceutical and Laboratory Water NF System Approximately 100–300 Da Specialty-water polishing Organic-load reduction Pre-treatment for high-purity water Municipal or softened water with low turbidity and controlled microbiological quality 5–15 bar 70–90% 5–35°C Activated carbon or alternative dechlorination, fine cartridge filtration, softening where needed, and hygienic system design NF generally does not provide complete sterilization or the ionic purity of a final high-purity-water stage. Sanitization and microbial control are essential.
9 Cooling-Tower Blowdown NF System Approximately 150–300 Da Water reuse Blowdown reduction Industrial utility water Cooling-tower blowdown after chemical conditioning and solids removal 8–20 bar 60–85% 10–40°C Removal of suspended solids, corrosion products, oil, and biofouling agents; cartridge filtration and antiscalant management Phosphate, silica, calcium, and biocide residues may influence fouling and concentrate quality. The treatment target should be matched to the reuse application.
10 Municipal Wastewater Reuse NF System Approximately 150–300 Da Non-potable reuse Industrial reuse Tertiary polishing Secondary or tertiary municipal effluent with consistent biological treatment 8–20 bar 60–85% 10–35°C Biological treatment, clarification, ultrafiltration or microfiltration, disinfection, and dechlorination when membrane-compatible materials require it NF can reduce hardness, color, natural organic matter, and selected micropollutants, but treatment performance varies by compound and should be verified by pilot testing.
Technical note: The pressure, recovery, temperature, molecular-weight cut-off, and feedwater ranges shown are typical engineering ranges rather than guaranteed performance values. Final system selection should be based on laboratory analysis, membrane compatibility, pilot testing, concentrate-disposal requirements, local water regulations, and the required product-water quality.

Purchasing Factors, Compliance Standards, and Total Ownership Costs

Choosing among the 10 best nanofiltration systems requires more than comparing flow rates. Feedwater testing should guide membrane selection, pressure settings, and pretreatment design. Measure hardness, turbidity, temperature, pH, and organic loading before requesting quotations. A clean laboratory sample can mislead buyers. Real water changes by season.

Compliance documents deserve careful review. Ask for material-contact declarations, pressure-vessel records, electrical safety files, and factory performance tests. Requirements vary by destination and application. Drinking-water projects may need approval under local potable-water rules, while industrial systems may follow different standards. Verify certificates with the issuing body. Do not rely on a supplier’s logo alone.

Total ownership cost includes more than the purchase price. Calculate energy use, replacement membranes, cleaning chemicals, labor, calibration, freight, training, wastewater handling, and planned downtime. Request a five-year cost model using your actual operating hours. Small details matter. A poorly sized pump can raise electricity costs every month. Pretreatment may add capital expense, yet it often protects membrane life and stabilizes output. During commissioning, record pressure, recovery, conductivity, and cleaning frequency. These records support warranty discussions and future audits. One practical weakness remains: projected savings can fail when feedwater quality differs from the test site. Leave room for spare parts, operator learning, and unexpected maintenance. Reliability is proven in operating records, not in attractive brochures.